By T. Randall Fortenbery
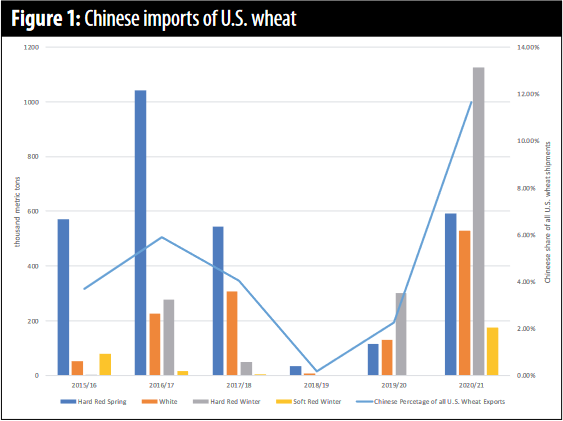
The Phase One trade deal between the U.S. and China has generally been seen as a major step forward after the trade friction between the world’s two largest economies beginning in 2018. This is especially true for the U.S. agricultural sector given that exports of agricultural products to China had virtually dried up beginning the second half of 2018. In the 2018/19 wheat marketing year (June 1, 2018-May 31, 2019), for example, China effectively imported no U.S. wheat, after accounting for about 5.5 percent of total U.S. wheat exports in the 2016/17 marketing year, the last full marketing year before trade was disrupted (Figure 1).
 The Phase One deal was signed Jan. 15, 2020, and went into effect Feb. 14, 2020. The deal is quite broad, but a centerpiece of the agreement committed China to purchase a total $200 billion more in goods and services from the U.S. over two years (2020 and 2021) than they purchased in 2017.
The agreement allows for two different approaches to calculating the 2017 baseline, so there is some debate as to the actual purchase levels required. The first calculates the baseline using U.S.-generated export statistics, and the second uses Chinese-generated import statistics. Not surprisingly, the two sets of statistics do not match up, but regardless of which is used, the Peterson Institute for International Economics (PIIE) calculates that China only met between 58 to 59 percent of their total committed import volume in 2020.1 They have done a bit better in 2021—through March, they had imported about 75 percent of their year-to-date target based on Chinese import statistics and about 61 percent based on U.S. export statistics.
The specific target for Chinese agricultural imports from the U.S. was an increase of between $32 and $36 billion over the 2017 baseline. This roughly translates into at least a $12.5 billion increase over the baseline in 2020 and $19.5 billion in 2021.2 According to CARD at Iowa State University, China achieved about 74.8 percent of the target in 2020, but was closer to being on target for 2021 early in the year.3
A particularly bright spot for Pacific Northwest farmers has been a significant increase in Chinese wheat imports from the U.S. recently, particularly white wheat. Figure 1 shows the significant uptake in Chinese wheat imports from the U.S. compared to the years just prior to the trade disruption. While improvement across all classes of wheat imports is impressive, the increases in both white and hard red winter wheat relative to earlier levels is particularly noteworthy.
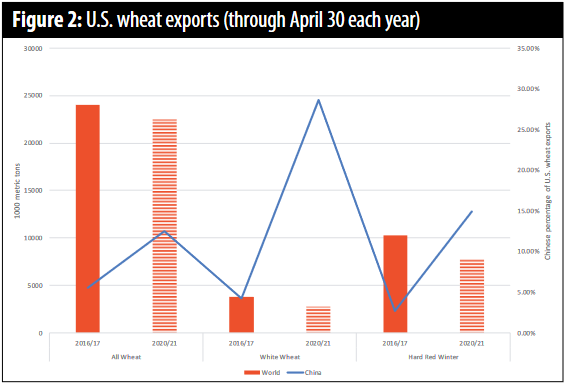 Figure 2 shows the percentage of U.S. wheat exports accounted for by Chinese purchases in the 2016/17 marketing year compared to 2020/21 through the end of April each year (one month before the end of the marketing year—end-of-year data for 2020/21 was not available at the time of this writing). Based on current estimates, total U.S. wheat exports for the 2020/21 marketing year were off about 6 percent compared to 2016/17 (the last full marketing year before trade disruptions). However, U.S. wheat exports to China were up 113 percent in 2020/21 compared to 2016/17. This includes a 318 percent increase in white wheat imports and a 319 percent increase in hard red winter wheat purchases.
The Phase One agreement has been a critical component in the increase in Chinese wheat purchases from the U.S., but current world feed grain markets have also contributed to Chinese demand for wheat. African Swine Fever was reported in China in August 2018, and within a year, the Chinese hog herd was officially reported to be down by more than 40 percent. Many market analysts believe the official Chinese statistics significantly underestimated the actual size of herd reduction, and the total reduction is closer to 50 percent.4 China had the largest swine herd in the world going into the crisis, and pork was the favored meat among Chinese consumers. In fact, the Chinese exhibit the largest per capita consumption of pork in the world.
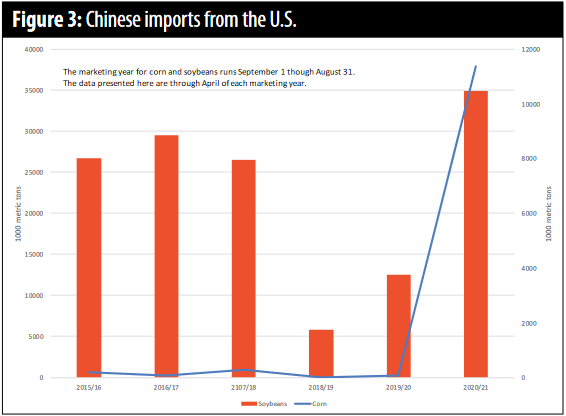 According to the American Farm Bureau, the disease is still prevalent in some parts of China.5 Despite this, the U.S. Department of Agriculture (USDA) is currently projecting a 14 percent increase in China’s pork production in 2021, as well as smaller increases in both beef and poultry production. The result has been a significant increase in Chinese imports of feed grains and plant protein this past year. Much of the import volume has come from the U.S. (Figure 3). However, a smaller-than-expected U.S corn crop last fall, coupled with a worldwide increase in feed grain demand, has resulted in a significant increase in global corn prices over the last several months. The result has been an increase in global wheat use as a feed grain, including in China. This likely explains the soft red wheat exports to China this year (Figure 1). Corn prices in China have exceeded wheat prices since the beginning of 2021, and corn is currently 10 to 12 percent more expensive than wheat. This, in turn, has led to an increase in wheat feeding and has contributed to the U.S. wheat price improvement experienced over the last several months.
Looking forward, we can think about current wheat trade with China in two ways. On the positive side, if the Phase One deal is honored and the trade war is behind us, we will continue to experience good demand for wheat from China. However, it is unlikely that the demand for wheat as a feed grain will persist unless other grains continue to be priced at a premium to wheat. Thus, total Chinese demand for U.S. wheat, and specifically soft red winter wheat, may dissipate a bit going into next year’s corn harvest. Even so, USDA is currently projecting China to account for a growing share of U.S. wheat exports in coming years.
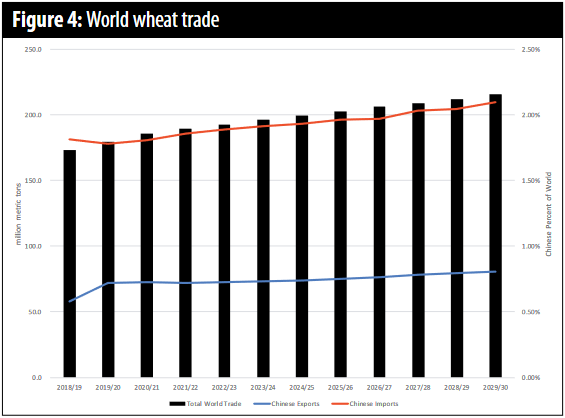 Figure 4 shows the current USDA estimate of total world wheat trade and the Chinese portions of both world exports and imports through the 2029/30 marketing year.6 According to the projection, world wheat trade will grow over the next decade. Chinese exports of wheat are expected to remain quite low at about .8 percent of total trade, but imports of wheat by China are expected to grow—from about 1.8 percent of total world trade in 2019/20 to 2.1 percent in 2029/30. This translates into a 17 percent increase in the Chinese market share of total world wheat imports.
The USDA’s long-term baseline forecasts an increase in the absolute volume of wheat exports from the U.S. over the next decade, but a decline in the total world market share of U.S. exports. The decline mostly comes at the expense of market share increases on the art of Russia and the EU, and as a result, U.S. growth in wheat exports flattens the last few years of the next decade. The U.S. share of total world wheat exports is expected to fall from about 14.7 percent in 2018/19 to 12.3 percent in 2029/30. However, U.S. wheat trade with China is expected to grow significantly over this same period.
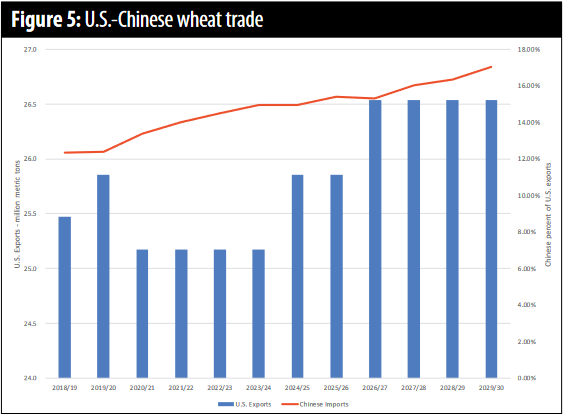 Figure 5 shows the USDA projection for future U.S. wheat trade with China. The percentage of total U.S. wheat exports captured by China is expected to grow over the next 10 years, and by 2029/30, account for more than 17 percent of U.S. wheat trade. This compares to less than 6 percent prior to the 2018/19 trade disruption.
Most all the future growth in Chinese wheat trade is expected to come from quality varieties, not wheat for livestock feed. This is good news for Pacific Northwest producers because it will lead to increased diversification among important white wheat customers, and if realized, can help stabilize markets going forward.